
高翔 , 黄卫
, 黄卫
GAO Xiang, HUANG Wei
中图分类号: TB321
文章编号: 1005-3093(2016)05-0321-08
通讯作者:
收稿日期: 2015-08-20
网络出版日期: 2016-05-25
版权声明: 2016 《材料研究学报》编辑部 《材料研究学报》编辑部
基金资助:
展开
摘要
使用动态力学分析的模量成像技术对硬化水泥净浆进行微观层次上的物相识别, 根据不同物相弹性性质的差异得到了目标区域的储能模量图, 辅以形貌观测、成分分析和原位静态压痕手段, 准确识别了未水化颗粒及其周边的高密度(High density, HD)和低密度(Low density, LD)CSH凝胶。结果表明, HD CSH凝胶和LD CSH凝胶的化学成分一致, 其各自的典型动态模量分别为36GPa和24GPa, 具有较好的区分度, 且该值与同样表征物相弹性性质的压痕模量数值近似, 动态模量成像图可给出清晰的物相边界。用该方法分析硬化水泥浆体微观性能, 可避免由于不能准确定位各物相而引起盲目性和重复工作, 有助于有的放矢地研究目标物相。
关键词:
Abstract
Phases in cement paste can be identified in micro scale by dynamic mechanical analysis (DMA) based modulus mapping owing to the characteristics of this technique: rapid, precise, high resolution and non-destructive. According to the storage modulus mapping which reflects the differences of elastic properties, the unhydrated clinker, as well as the high density calcium silicate hydrate (CSH) gel and low density CSH gel, which surrounded the clinker can be recognized with the assistance of morphology observation, components analysis and in-situ static indentation etc. Results show that the chemical composition of HD CSH and LD CSH is the same, while their storage modulus are 36GPa and 24GPa respectively, and the phase identification can be accomplished by taking the individual storage modulus into account. Therefore, blindness and repetition in traditional experiments can be avoided by employing the method of DMA-based modulus mapping, and then the properties of interested phase can be acquired with targeted approach.
Keywords:
在不同尺度上, 水泥基材料均有多物相、异质的特点。研究微观尺度上的不同物相, 得到材料的本质特性并预测宏观行为, 是避免重复试验、使研究结果具有普适性的理性思路。就硬化水泥浆体而言, 微观层次的物相包括组成水泥的多种矿物(主要包括C3S、C2S、C3A和C4AF)及其水化形成的CSH凝胶、CH、AFt和AFm等不同的水化产物。其中CSH凝胶是材料一切性能的核心, 控制着诸如力学性质、体积稳定性、渗透性等。CSH凝胶本身又具有多尺度特征, 其纳观结构由CSH固体颗粒和凝胶孔组成, 微观结构由纳观结构和毛细孔组成。其形式复杂、无定型, 最基本的原子和纳观结构尚不清楚。因此, 在微观层面上分析CSH凝胶的性能是当下硬化水泥浆体研究的热点。
与微观形貌观测、成分分析等研究相比, CSH凝胶微观力学性能的研究起步较晚, 但近年来发展迅速。主流的做法是应用纳米力学技术在材料表面进行压痕试验, 记录连续的位移-荷载曲线, 依据力学理论进行分析。鉴于硬化水泥浆体中物相混杂, 传统试验思路难以得到有效数据, 因此采用其他手段辅助试验。较为盛行的是将纳米压痕技术与数理统计处理手段相结合, 通过点阵形式“盲”压, 选取恰当点阵间距以保证单个压痕在统计学意义上的独立性, 得到大样本数据后进行解卷积从而解析出各物相的力学特性和所占比例[1]。该方法的思路新颖, 推动了硬化水泥浆体微观尺度的表征, 但是在物相的代表性方面仍存在一些争议[2], 即用盲压得到的数据样本是否可看作单一物相用于进一步的分析。为了解决该问题也做出了相关的尝试, 如: 对压痕位置的形貌或者成分进行分析从而实现后验[3, 4]。本文则提出, 从先验角度出发使用模量成像技术并基于动态力学分析(DMA), 先对物相进行准确识别再进一步探究各物相的性质, 以避免各物相研究的盲目性。
动态模量成像是一种集成了纳米尺度的动态力学分析和扫描探针显微镜技术的试验方法, 使用一个振动的针尖接触和扫描样品表面, 并将针尖接收到力的反馈转化成某种力学性能的衬度, 从而得到力学性能在扫描区域的分布图, 是测定多相材料区域力学性能的理想工具[5]。目前, 该技术已经广泛应用于医学[6]、生物复合材料[7]、纤维[5]、高分子材料[8]等领域。近年来也有人将该方法用于硬化水泥浆体的研究, 如Li[9]等对比了模量成像与静态压入法对硬化水泥浆体弹性性质的表征, 其中静态压入得到的弹性模量可能较大, 但二者差异并不明显; Xu等[10]应用DMA技术的高分辨率特征甄别了未水化颗粒与水化产物之间界面区的宽度, 求得结果的精度高于传统静态压入方法两个量级。
因为动态模量成像压入深度浅、试验速度快、测试全程对样品无损且分辨率高, 可以进行硬化水泥浆体微观层次上的物相划分, 尤其是识别不同的CSH凝胶相。本文在前人工作的基础上使用基于动态力学分析的模量成像技术对硬化水泥净浆试件进行测试分析, 并辅以形貌观测、成分分析和静态压入的手段进行验证, 以实现快速识别目标区域物相种类, 并得到其特征性质。
本文使用TriboIndenter原位纳米力学测试系统测试硬化水泥浆体的微观力学性质: 基于动态力学分析的模量成像技术在目标区域测得256×256个点在振动荷载下的响应, 反映该区域力学性质的变化细节, 通过代表弹性性能的储能模量快速划分目标区域的物相; 在已识别的不同物相上采用静态压入方法, 得到压痕点的位移-荷载曲线以解析压痕模量和硬度; 并在各压痕点附近进行形貌观测和能谱分析以判定其化学组成成分, 验证动态模量成像技术物相识别结果。
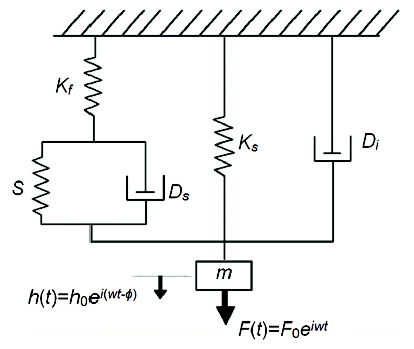
动态纳米压入技术的基本原理, 是在微小接触载荷下压针以高频正弦动态载荷扫描样品表面, 通过记录压针在样品表面的深度幅值和相位滞后获取样品的动态特性分布图。其加载为在静态载荷上叠加一组正弦载荷, 如图1所示。
此时针尖的振动方程为
其中F(t)为施加的动态载荷, h(t)为动态载荷作用下的压入深度, m为针尖的质量。D和K分别为等效阻尼和等效刚度, 由公式
和
给出, 其中Di和Ds分别为系统阻尼和接触阻尼, Ks和Kf分别为支持弹簧的刚度和系统刚度(通常系统刚度远大于弹簧刚度, 因此忽略不计); S ′为被测材料的储能刚度。将动态载荷F(t)=F0eiωt和动态压入
深度h(t)=h0ei(ωt-ϕ)代入到公式(1), 可求得储能刚度S ′和损耗刚度ωDs
其中F0和h0分别为动态载荷的幅值和位移振幅; ω为圆频率, ϕ为动态载荷与位移的相角。在此基础上, 采用Hertz接触理论并假设在浅压下针尖形状为球形, 此时储能模量E ′和损耗模量E ′′定义为
其中F为静态载荷和动态载荷叠加作用下实际测量的接触力, Rtip为针尖的曲率半径。通常针尖由于加工缺陷和磨损, 其实际曲率半径不同于初始的曲率半径, 且随使用时间而变化。一般基于标准件的已知储能模量根据公式(6)反推针尖的实际曲率半径, 再代入所测材料, 从而得到比较真实的数值。
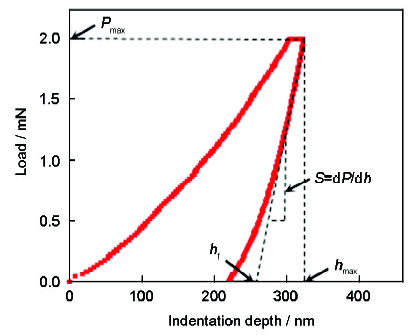
静态纳米力学压入技术, 在硬化水泥浆体的研究中属于较为常规的手段之一。根据记录压头压入深度连续变化的曲线, 求解力学性质。图2给出了硬化水泥浆体在纳米压痕试验中的典型加载-卸载曲线。压痕模量和压痕硬度由下式定义并算出:
其中β为压头校正系数, 对于本试验中所用的Berkovich压头, β=1.034; S为接触刚度, 由代表弹性阶段的卸载曲线的上半部分拟合, 如图2所示; Pmax为最大荷载; Ac为最大荷载时压头与试件的接触面积, 鉴于卸载过程中压头和样品时间的接触半径不断变化, 该接触面积可由Oliver-Pharr法则求解得到。
此外, 本文还使用TESCAN LYRA 3聚焦离子束扫描显微镜在高真空模式下观察上述进行力学性质表征的目标区域的微观形貌; 并用附带的EDS能谱分析物相的组成。
实验中使用的基准水泥比表面积为350 m2/kg, 化学组成列于表1。试件的水灰比为0.3, 密闭养护约三年后取出。由于微观试验的尺度限制, 对试件表面的平整度有苛刻的要求。Miller等[11]用粗糙度Rq表征样品表面的粗糙情况, 由式(10)算出。并推荐了至少2 h的分级打磨、抛光的步骤, 着重强调了使用1 μm的金刚石抛光膏。
其中A和B为原子力显微镜(Atomic Force Microscope, AFM)拍照选取像素值, zij为点(i, j)的高度与平均高度之差。
表1 原材料化学组成(质量分数, %)
Table 1 Chemical composition of raw materials (%, mass fraction)
| Al2O3 | Fe2O3 | CaO | MgO | SO3 | SiO2 | Na2Oeq |
|---|---|---|---|---|---|---|
| 4.03 | 3.46 | 61.5 | 2.60 | 2.83 | 21.58 | 0.51 |
将抛光后的试样放在AFM扫描电镜下观测其平整度。图3给出了50 μm×50 μm平面范围内的试件表面粗糙度情况图, 经过上述抛光处理后的试件表面粗糙度可以达到30 nm左右。就动态力学分析技术应用于其他材料, 在较小范围内的粗糙度可能达到纳米级别[5], 但是文献中面向动态力学分析的其他材料在较大范围内(50 μm×50 μm)的粗糙度也在数十纳米左右[12]; 另一方面就硬化水泥浆体本身而言, 除了专门表征未水化颗粒表面的情况外, 本试件的粗糙度已属较好的情况[11]。学者们对同量级粗糙度的硬化水泥浆体进行动态力学分析[9, 10], 也取得了可靠的结果。
水泥颗粒水化形成的主要水化产物是CSH凝胶。由于水化进程早期浆体内孔隙较大, 致使水化产物生成和生长有较大空间, 从而形成低密度(堆积密度为0.64)的C-S-H凝胶体; 随着水化的进行早期生成的水化产物逐渐包裹住未水化颗粒, 未水化颗粒固相反应生成了新的水化产物, 而此时浆体中孔隙体积逐渐较少, 新生成的水化产物生长空间受限, 凝胶颗粒相互接触, 产生表面压力, 此时水化产物堆积紧密, 对应于Jennings模型中堆积密度为0.74的高密度(High density, HD)CSH凝胶体。
考虑到材料多物相和非均质特性, 以及所能达到的表面平整度加工水平, 在多次尝试后本试验设置静态荷载为4 μN, 动态振幅为3.5 μN, 动态加载频率为200 Hz, 扫描频率为0.5 Hz。从而使压入位移保持在一个适中的范围, 即保证了足够大的信噪比以获得可信的数据, 也满足了足够小的影响区域避免各点之间的相互干扰。
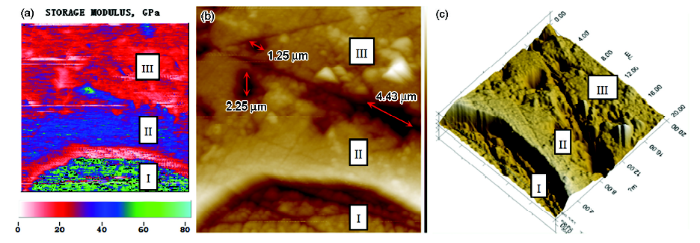
图4给出了20 μm×20 μm的目标区域内基于动态模量成像技术得到的组图: 其中4(a)由被扫描区域上平均分布的256×256个数据点的储能模量绘制而成, 分辨率为0.08 μm, 选取多种颜色对数据分布情况进行直观表征。从图中可以看出, 该区域内自下而上分布着三种力学性质迥异的物相, 它们的储能模量呈现由高至低的趋势。代表未水化颗粒的物相I在模量图中以夹杂着蓝色的绿色为主, 储能模量主要分布在50 GPa以上; 代表HD CSH的物相II(蓝色)的储能模量集中分布在30 GPa-50 GPa的范围内; 而红色的物相III——LD CSH的储能模量则基本处于20 GPa-30 GPa之间。三者区分度明显且界限清晰, 因此满足物相识别工作中直观性和精确度的要求。图4(b)和4(c)分别表征目标区域的形貌和相对高差, 可以看出: 未水化颗粒上有清晰的划痕, 且材料软硬不同导致抛光时受力不均, 该区域高程整体低于水化产物; 而HD CSH比较均匀且致密, LD CSH则比较疏松且夹杂着微米级别的孔隙(图4c)。
图4 动态模量图像及光镜图、形貌图和三维图
Fig.4 Target test area and its modulus mapping, topography and 3D photo, (a) modulus mapping, (b) topography, (c) 3D photo
依据基于动态模量成像技术得到的组图, 可以对研究区域的物相进行初步划分。其中储能模量图的对比程度显著, 界限清晰, 因此将其作为识别物相的主要参考, 同时也便于提取各物相力学性质的具体数值, 从而实现定量分析。
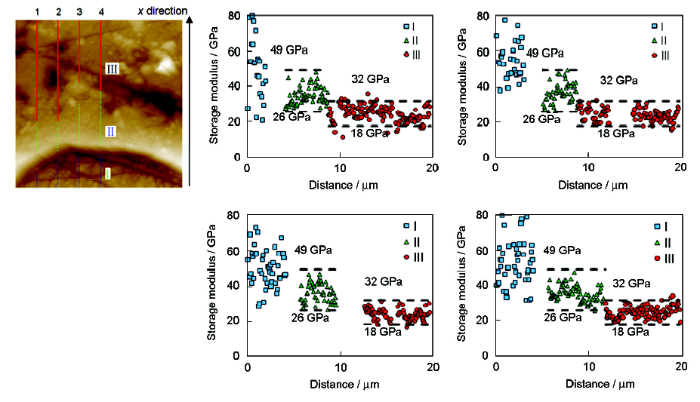
基于上文的判断, 图4区域中的三种物相呈纵向分布, 鉴于模量成像图实际是由256×256个数据点绘制而成, 在该区域选择若干条纵线可以提取线扫描数据, 画出储能模量随位置变化的情况以进行定量分析。图5(a)示意了所选取4条纵线的具体位置, 未水化颗粒、HD CSH凝胶和LD CSH凝胶三种物相分别用蓝色、绿色和红色的线段标记; 图5(b)-5(e)表示各条纵线上储能模量随位置的变化, 其中x轴代表自下而上的方向。
图5 纵线上储能模量随位置的变化
Fig.5 Images of storage modulus at specific cross sections, (a) schematic of specific cross sections, (b) storage modulus at line 1, (c) storage modulus at line 2, (d) storage modulus at line 3, (e) storage modulus at line 4
依据各纵线上储能模量的波动, 可以直观诠释三种不同物相: 未水化颗粒(物相I)模量值最高, 但是可见的划痕导致其表面具有明显的高程落差, 因此该区域的模量起伏也最大; 致密的HD CSH的模量分布在26 GPa-49 GPa的范围内, 疏松的LD CSH的模量至则集中在18-32 GPa。界面区位于不同物相之间, 无损试验的模量成像技术对试件表面施力很小, 界面区存在的微小表面起伏会造成实测值的波动, 因此在分析各单一物相的力学特征时不考虑界面区或大孔的数据。
单一物相的实测数据总是落在同样的模量区间内, 尤其是依据储能模量图4(a)划分的两种CSH凝胶相界限清晰, 差异明显。从图5(b)-5(e)可以看出, 随机选取四条纵线上的两种物相模量均可被26-49 GPa和16-32 GPa两个模量范围包括, 因此模量成像技术在定量分析中具有可重复性。另一方面, 储能模量主要表征的是材料的弹性性质, 则动态模量成像技术得到的分相结果可以与大样本纳米压痕方法解析出的各物相典型弹性特征对照。鉴于两种方法加载模式不同导致影响范围有所差异, 常用静态压痕加载制度的单个数据点影响微米尺度的区域[3], 而本文选用的动态模量成像技术分辨率为0.08 μm, 因此分别取图5(b)-5(e)中已识别的HD CSH和LD CSH凝胶储能模量的平均值作为各物相动态模量的代表值, 如表2所示, 其影响范围也达到了与静态压痕相同的微米尺度, 二者的对照更有意义。相同配比试件的HD CSH和LD CSH的压痕模量分别为36.1 GPa和23.7 GPa[14], 与其分别的储能模量值基本吻合。
表2 纵线上两相水化产物储能模量值对比
Table 2 Storage modulus of two different phases in cross sections
| Phase | Average of storage modulus / GPa | Range of storage modulus / GPa | Indentation modulus / GPa | |||
|---|---|---|---|---|---|---|
| line 1 | line 2 | Line3 | Line4 | |||
| HD CSH | 35.23 | 36.26 | 35.57 | 35.07 | 26-49 | 36.1 |
| LD CSH | 24.42 | 23.23 | 23.53 | 24.92 | 18-32 | 23.7 |
3.3 EDS/NI验证
本文设计了辅助试验用以验证基于动态模量成像技术识别的未水化颗粒、HD CSH和LD CSH三种物相: 用扫描电镜及其附带能谱进行形貌观测和成分分析, 同时根据已划分的物相进行针对性原位静态压痕研究, 解析水化产物的力学性质, 结果如图6所示。
图6 研究区域(约30 μm×30 μm)形貌图及EDS/NI试验示意图
Fig.6 Schematic of EDS/NI experiments on target area and its topography, (a) SEM photo of indentaion area, (b) AFM photo of indentation area, (c) location of EDS/NI experiments and schematic of different phase
在原位压痕试验中, 出于对信噪比的考虑, 选择静态纳米压痕的最大荷载Pmax=2 mN, 使其平均压入深度为200 nm-300 nm, 高于表面粗糙度一个量级, 同时该尺寸也小于水化产物的特征尺寸, 符合经验判别法则。关于热漂移补偿, 则通过前置相同时长的试验, 取时间-位移斜率作为热漂移项, 在实测数值中减去对应时间的热漂移数值来完成。
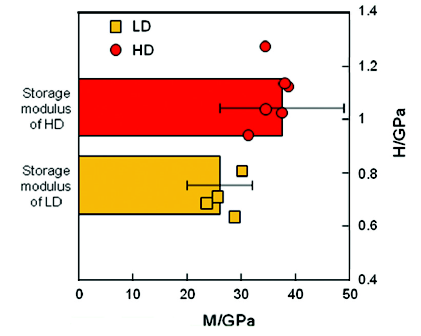
按照上述方法, 在如图6(c)所示已识别的物相上共选取15片微区进行压入。其中位于未水化颗粒(Clinker)上的压痕点模量接近100 GPa。卸载后的残余面积约为100 nm2, 在图示30 μm×30 μm的目标区域较难发现, 在图6(c)中用?表示; 无序号的三角形为明显压在Clinker/HD复合物相上的点。上述两种标识对应图4中的物相I和I/II界面区。带序号的三角形是针对CSH凝胶物相的压痕点, 通过前置的动态模量成像步骤可以区分HD CSH和LD CSH的边界从而辨别压痕数据的分类, 而与静态压痕同步进行的成像可避免压痕点之间的相互干扰以保证数据样本的独立性。通过1.2节中的力学计算方法求得CSH凝胶上的压痕点力学性质, 如图7中的散点所示。鉴于动态模量试验中得到的储能模量反映的也是材料的弹性性质, 可作为静态压入得到的压痕模量的对照。从图7可以看出, 通过动态模量成像技术识别的不同物相, 其弹性模量和压痕硬度有较大的区分度: 其中LD CSH的弹性模量为23.80-30.09 GPa, 硬度为0.63-0.81 GPa; HD CSH的弹性模量为31.29-38.74 GPa, 硬度为0.94-1.27 GPa。根据静态压入得到的各相压痕模量也均落到了同样表征材料弹性性质储能模量的范围内, 而动态模量成像技术对样品表面更加敏感, 因此得到的储能模量范围更大, 见图7中的条状图。事实上, 两相CSH凝胶广泛存在于硬化水泥浆体中, 决定材料宏观性能的配比、掺入物和养护条件等因素并不影响HD CSH和LD CSH的力学特征。从自下而上的尺度分析的角度来看, 力学性质稳定的两相CSH凝胶基于不同的体积分数可以作为未水化颗粒和其他水化产物(主要为CH)的基质, 从而组成了更大尺度的水泥净浆, 而正是上述配比、掺入物和养护条件等宏观因素影响了HD CSH和LD CSH各自的体积分数, 导致了不同的宏观力学性质。
图7 静态压入点的力学特征及其与储能模量的对照
Fig.7 Mechanical parameters determined by nanoindentation and comparison between storage modulus and indentation modulus
在水泥水化进程中未水化颗粒水解释放出离子, 在其表面覆盖一层水化物的保护膜, 保护膜的内部溶液浓度高于外部溶液产生渗透压力差导致水被吸入, 进而薄膜不断向外推进, 钙离子可以顺利穿过薄膜而硅酸盐离子较难穿过, 直至外部溶液中的钙离子及内部溶液中硅酸盐离子浓度足够高时, 渗透压力导致保护膜破裂, 硅酸盐离子与钙离子结合形成不定形的CSH凝胶[15]。因此通过形貌观测和成分分析, 可以验证动态模量技术对未水化颗粒和水化产物的划分: 在扫描电镜(SEM)下观测形貌特征, 并使用电镜附带的能谱分析技术(EDS)测定物质成分。鉴于低电压下SEM的探测范围较浅, 但相应对该较浅深度内的起伏情况表征更清晰, 本文在SEM扫描时选择了5 kV的加速电压着重强调表面的起伏情况以快速寻找压痕点的位置, 而在EDS分析时切换为15 kV的加速电压使得成分分析的范围为目标测点周围1 μm3, 与原位压痕的影响尺度近似, 便于将用两种试验方法得到的结果进行对照。
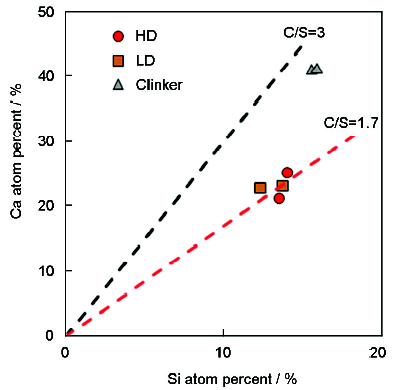
图6(c)中带有编号的小矩形框为EDS测点, 统计六个点各元素质量占比, 其中Ca、Si和O三种元素占全部元素质量分数的90%以上, 如图8所示, 据此可以判定该区域为C3S或C2S及其水化形成CSH凝胶。研究了Ca和Si两种元素的摩尔比值, 结果如图9所示。可以看出, 基于动态模量成像技术区分的未水化颗粒和水化产物的Ca/Si比有较大差异: 其中未水化颗粒的Ca/Si≈2.6, 而水化产物的Ca/Si比均约为1.7, 为典型的CSH凝胶的特征[16]。但是HD CSH和LDCSH的Ca/Si比并无明显差异或规律, 说明两种CSH凝胶的化学成分相似, 即它们由同种纳观凝胶颗粒依照不同堆积形式组成, 其微观力学性能的差异取决于不同的微观结构, 与Ca/Si比无关[17]。因此与传统方法相比, 动态模量成像在区分不同CSH凝胶相方面有独特的优势。
1. 对于硬化水泥浆体观层次性质的表征, 能谱技术区分物相的核心是成分或原子序数的差异, 因此较难识别不同密度的CSH凝胶相; 用扫描电镜尽管可观测到由于密度不同导致物相形貌的差别, 但不同物相间的界限模糊, 因此物相识别更适用于作为一种辅助手段; 用传统纳米压痕方法识别物相需要进行大量点阵试验, 且基于大样本数据分相不可避免会引入主观因素。动态模量成像技术用于硬化水泥浆体在微观层次上的物相识别和表征, 有速度快、定位准确、分辨率高且测试全程对样品无损等优点, 能精确反映目标区域力学性质变化细节从而进行物相划分, 尤其是可识别两种成分相同但密度不同的CSH凝胶。
2. HD CSH凝胶与LD CSH凝胶自内而外依次包裹未水化颗粒。动态模量成像技术能较为清晰地识别三个物相, 尤其是对于堆积密度不同的两种CSH凝胶, 其组成成分相似且Ca/Si比均为1.7左右但弹性性质差别明显, 通过动态模量成像技术精确划分了二者的边界并确定了储能模量范围: HD CSH为26-49 GPa, LD CSH为18-32 GPa。物相识别结果保证了单一物相性质研究的精确性: HD CSH的压痕模量为31-39 GPa, 压痕硬度为0.94-1.27 GPa; LD CSH的压痕模量为24-30 GPa, 压痕硬度为0.63-0.81 GPa。
The authors have declared that no competing interests exist.
| [1] |
Statistical indentation techniques for hydrated nanocomposites: concrete, bone, and shale , |
| [2] |
A critical examination of statistical nanoindentation on model materials and hardened cement pastes based on virtual experiments ,
<h2 class="secHeading" id="section_abstract">Abstract</h2><p id="">Recent results of statistical nanoindentation testing on hardened cement pastes (HCP) reported in the literature show a multipeak response in the elastic modulus frequency plots. These peaks have been interpreted as indicating the true elastic modulus of two calcium silicate hydrate (C–S–H) phases of different densities.</p><p id="">However, the application of statistical indentation for determining material properties of single phases in HCP appears to violate some of the basic principles of the technique. To elucidate this aspect, virtual experiments emulating statistical nanoindentation are performed and presented in this paper. They are based on 3D images of: (i) an idealized two-phase material and (ii) HCP acquired by focussed ion beam nanotomography (FIB-nt); within both 3D images, a marching object is sampled over a large number of positions. Based on the local phase composition within the marching object, a local stiffness is estimated by using simple composite models. Due to the large number of the investigated positions, the elastic modulus can be statistically evaluated in the same manner as in the real statistical indentation experiments.</p><p id="">The results presented in this paper indicate that the homogenous C–S–H regions present in HCP are too small to cause independent and separated peaks in the elastic modulus plots. Moreover, the presence of phases other than C–S–H, namely unhydrated cement and calcium hydroxide, may also produce spurious peaks in the frequency plots. In conclusion, the presented results question the notion that the multipeak signature in statistical nanoindentation experiments on HCP can be explained only by the presence of two distinct C–S–H phases.</p>
|
| [3] |
A coupled nanoindentation/SEM-EDS study on low water/cement ratio portland cement paste: evidence for C-S-H/Ca (OH) 2 nanocomposites , |
| [4] |
Microstructure and mechanical properties of fly ash blended cement pastes , |
| [5] |
Characterization on topography and dimension of the interphase structure in carbon fiber composites ,碳纤维复合材料界面结构的形貌与尺寸的表征 ,
<p>为了准确测定碳纤维增强树脂基复合材料界面结构的形貌和尺寸, 本文中介绍了一种原位纳米力学动态模量成像技术, 并采用该方法对碳纤维增强热固性树脂基复合材料进行了测试, 对该技术在界面结构测试上的参数设置、 数据处理方法以及适用性等方面进行了分析。研究表明, 该方法的横向分辨率可以达到纳米尺度, 适于测量界面尺寸在纳米级别的碳纤维复合材料界面形貌与尺寸。对于碳纤维/环氧树脂和碳纤维/双马树脂体系, 界面区的储能模量呈梯度变化, 根据储能模量成像图的统计分析可得到界面的形貌和厚度。所得界面平均厚度在100nm左右, 横截面上界面形貌呈不均匀的“河流状”, 并与碳纤维表面形貌相似。</p>
|
| [6] |
Evaluation of a new modulus mapping technique to investigate microstructural features of human teeth ,
<h2 class="secHeading" id="section_abstract">Abstract</h2><p id="">Teeth contain several calcified tissues with junctions that provide interfaces between dissimilar tissues. These junctions have been difficult to characterize because of their small size. In this work a new technique using a combination of atomic force microscopy (AFM) and a force–displacement transducer was used to simultaneously study the surface topography and map mechanical properties of the junctions and adjacent hard tissues. Prepared specimens from human third molars were scanned by an AFM piezo-tube in contact mode. To measure the dynamic viscoelastic properties of the material a small sinusoidal force was superimposed on the contact force and the resulting displacement amplitude and the phase shift between the force and amplitude were measured. This force modulation technique was used to map the local variation of nanomechanical properties of intertubular dentin, peritubular dentin, enamel, dentin–enamel junction (DEJ) and peritubular–intertubular dentin junction (PIJ). This new technique allowed us to measure the widths of these junctions in addition to local variation in dentin and enamel without causing plastic deformation to the material and with 2 orders of magnitude increase in spatial resolution compared with previous studies that used discrete nanoindentation techniques. Due to the ability to analyze the sample line-by-line, the distribution functions associated with the width of the DEJ and PIJ were conveniently obtained for specific intratooth locations. The data suggested, for three third molar specimens, a DEJ width of 2–3 μm with full-width half-maximum (FWHM) of 0.7 μm and PIJ width of 0.5–1.0 μm with 0.3 μm FWHM. The intertubular dentin storage modulus variation was between 17 and 23 GPa with a mean value of 21 GPa. The range of storage modulus for enamel near the DEJ was between 51 and 74 GPa with a mean value of 63 GPa.</p>
|
| [7] |
Micromechanical properties of a hydroxyapatite/poly-L-lactidebiocomposite using nanoindentation and modulus mapping , |
| [8] |
Quantitative mapping of elastic moduli at the nanoscale in phase separated polyurethanes by AFM ,
The micro phase separated nanoscale morphology of phase separated polyurethanes (PUs) was visualized by atomic force microscopy (AFM) height and phase imaging of smooth surfaces obtained by ultramicrotonomy. PUs were obtained from 4,4'-methylenbis (phenyl isocyanate) (MDI), 1,4-butanediol (BD) and poly(tetrahydrofurane) polyether polyol (PTHF). The segmented polyether PUs with varying stoichiometric ratio of the isocyanate and hydroxyl groups were prepared to investigate the effect of molar mass, as well as the type and number of end-groups on their morphology and mechanical performance. The PU samples studied show characteristic "fingerprint" AFM phase images. Novel dynamic imaging modes of AFM, including HarmoniX material mapping and Peak Force Tapping were used to assess the mechanical performance of phase separated polyurethanes quantitatively as a function of their molecular structure. The values of surface elastic moduli were determined with nanoscale resolution and were in excellent agreement for both AFM modes. While tensile testing provides a bulk average value for the elastic modulus of the elastomers, the novel AFM based elastic moduli mappings introduced enable the study of surface stiffness with nanoscale resolution in a quantitative way. (C) 2010 Elsevier Ltd. All rights reserved.
|
| [9] |
Comparative investigation on nanomechanical properties of hardened cement paste , |
| [10] |
Nanomechanical properties of CSH gel/cement grain interface by using nanoindentation and modulus mapping , |
| [11] |
Surface roughness criteria for cement paste nanoindentation ,
<h2 class="secHeading" id="section_abstract">Abstract</h2><p id="">Analysis of nanoindentation experiments assumes that the indentation occurs on a flat surface. As a result, the accuracy of nanoindentation depends on reducing the surface roughness to a tolerable level. Within the context of statistical nanoindentation techniques suitable for heterogeneous materials, this study presents a criterion for roughness of cement paste surfaces for nanoindentation, and describes a method for obtaining the desired roughness. Through a systematic experimental study, we show the evolution of roughness and nanomechanical properties from indentation as a function of increased polishing. We conclude that the root-mean-squared (RMS) roughness of the sample, taken over a square area with edge dimensions of 200 times the average indentation depth of the dominating phase of the material, should be less than five times the average indentation depth of the dominating phase of the material.</p>
|
| [12] |
Microstructure and mechanical properties of an alumina-glass low temperature co-fired ceramic ,
<h2 class="secHeading" id="section_abstract">Abstract</h2><p id="">The microstructure and mechanical properties of an alumina–glass low temperature co-fired ceramic (LTCC) have been investigated. The microstructure was studied by using optical microscope, scanning electron microscope, energy spectrum analysis and X-ray diffraction. The Young's modulus, hardness, flexure strength and fracture toughness were measured by three-point bending, indentation and nanoindentation tests. The LTCC can be regarded as a particle-reinforced composite with macroscopically isotropic properties: particles mainly composed of synthetic corundum and matrix mainly of corundum and silica. The particles with irregular shape and an average radius of 0.71 μm are homogeneously dispersed in the matrix. The properties of the individual particle and matrix were successfully measured and further used to obtain the effective properties of the composite by micromechanics methods. The existence of rigid particles improves not only the modulus, hardness and strength but also the fracture toughness of LTCC materials.</p>
|
| [13] |
Refinements to colloid model of CSH in cement: CM-II ,
<h2 class="secHeading" id="section_abstract">Abstract</h2><p id="">This paper describes a second generation model for the nanostructure of C-S-H based on the interpretation of water sorption isotherms. The cornerstone of the model is a description of the globules (used here to mean small brick like particles), which consist of solid C-S-H and internal water, and the distribution of water in the small pores between them. Microstructural changes that occur during drying and account for both reversible and irreversible shrinkage are described. Since globules are particles, the properties of C-S-H gel are best understood through application of the emerging granular mechanics. This new model should help to establish quantitative relationships between the nanostructure and bulk properties.</p>
|
| [14] |
Nanogranular origin of concrete creep , |
| [15] |
Investigation on the early stage hydration of portland cement using enviromental scanning electron microscopy ,环境扫描电镜用于硅酸盐水泥早期水化的研究 , |
| [16] |
Composition and density of nanoscale calcium-silicate-hydrate in cement , |
| [17] |
Characteristics of two types of C-S-H gel in hardened complex binder pastes blended with slag ,纳米压痕研究含矿渣硬化浆体C-S-H 凝胶的特性 , |

/
| 〈 |
|
〉 |


